


Headlines have warned about the inverted yield curve for the past couple of years. And for good reason: it’s one of the most closely watched indicators of potential economic trouble. But recently, something notable happened—the curve has “uninverted,” or normalized—for the first time in what had been the most prolonged inversion in history.
So what does that mean for the economy, and more importantly, what does it mean for you as an investor?
What Is the Yield Curve, and Why Does It Matter?
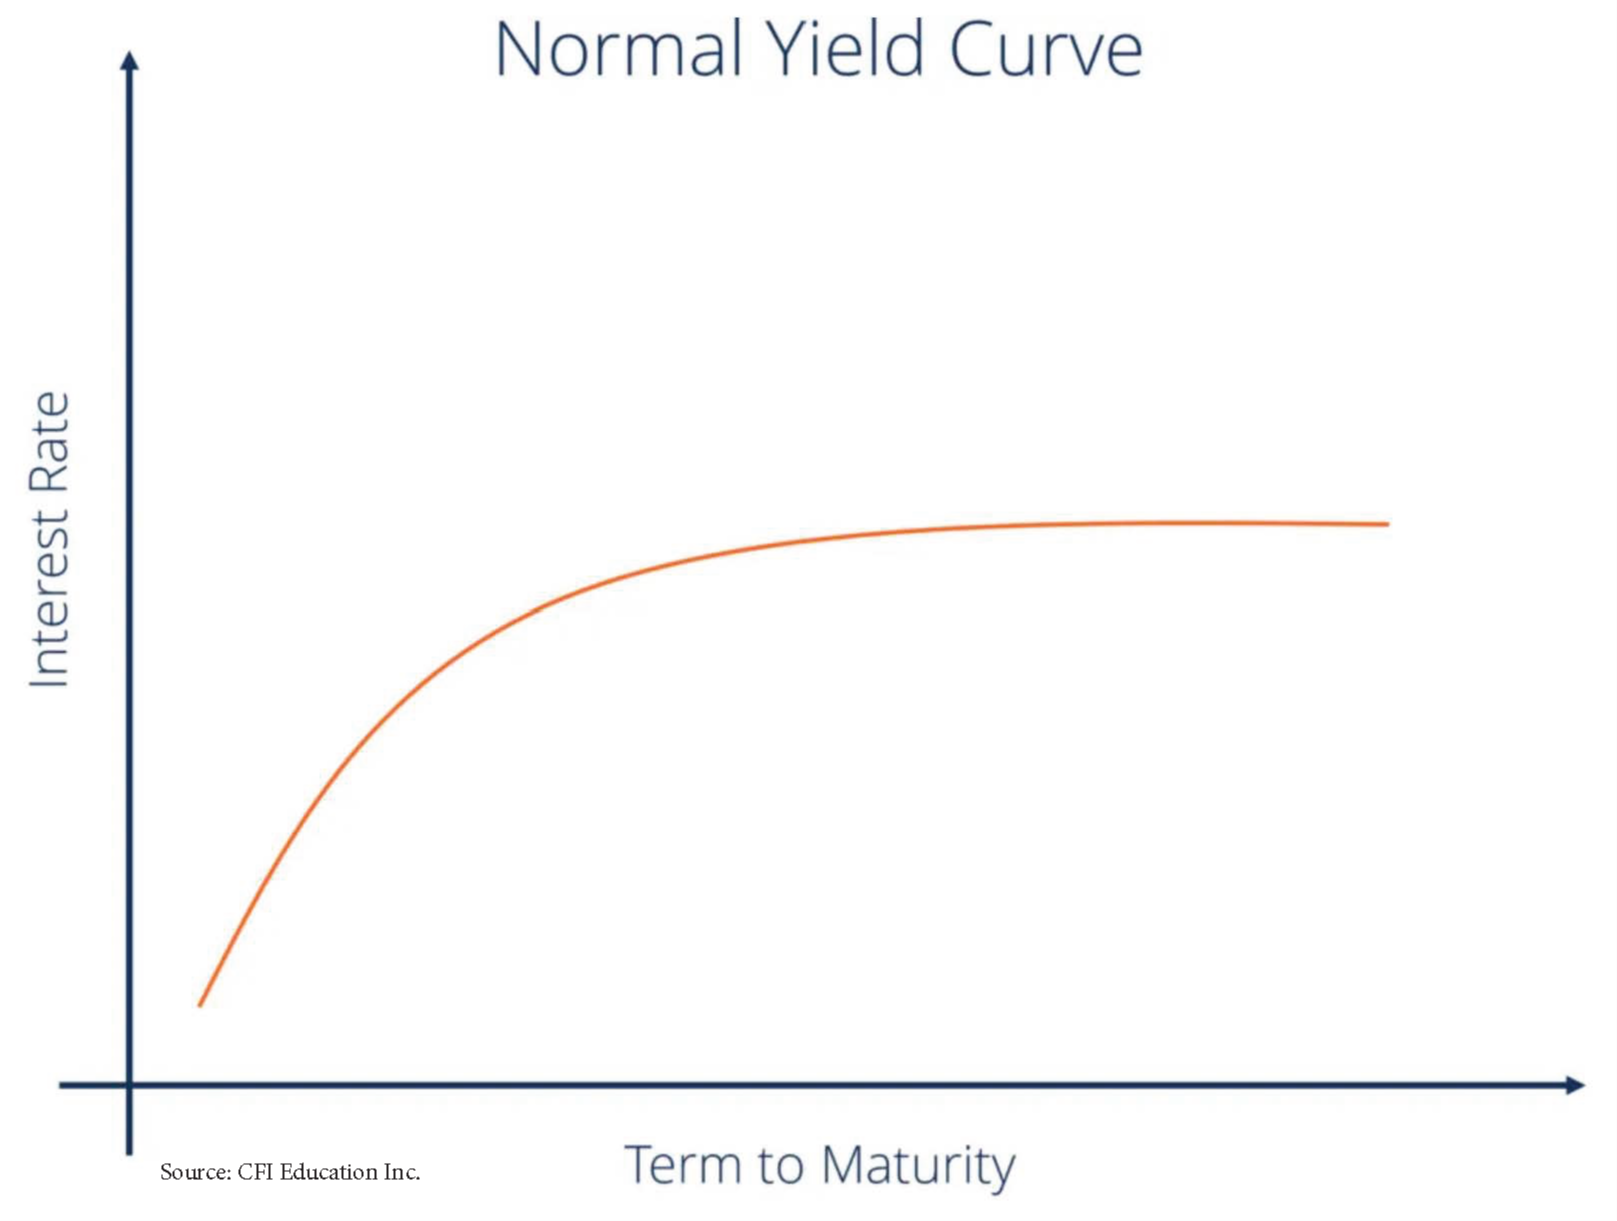
The bond yield curve is simply a chart that shows the interest rates (or yields) on U.S. Treasury bonds of different maturities—from short-term (like 3-month or 2-year bonds) to long-term (like 10-year or 30-year bonds).
In a healthy economy, longer-term bonds typically offer higher yields to compensate investors for locking up their money for longer, creating an upward-sloping curve.
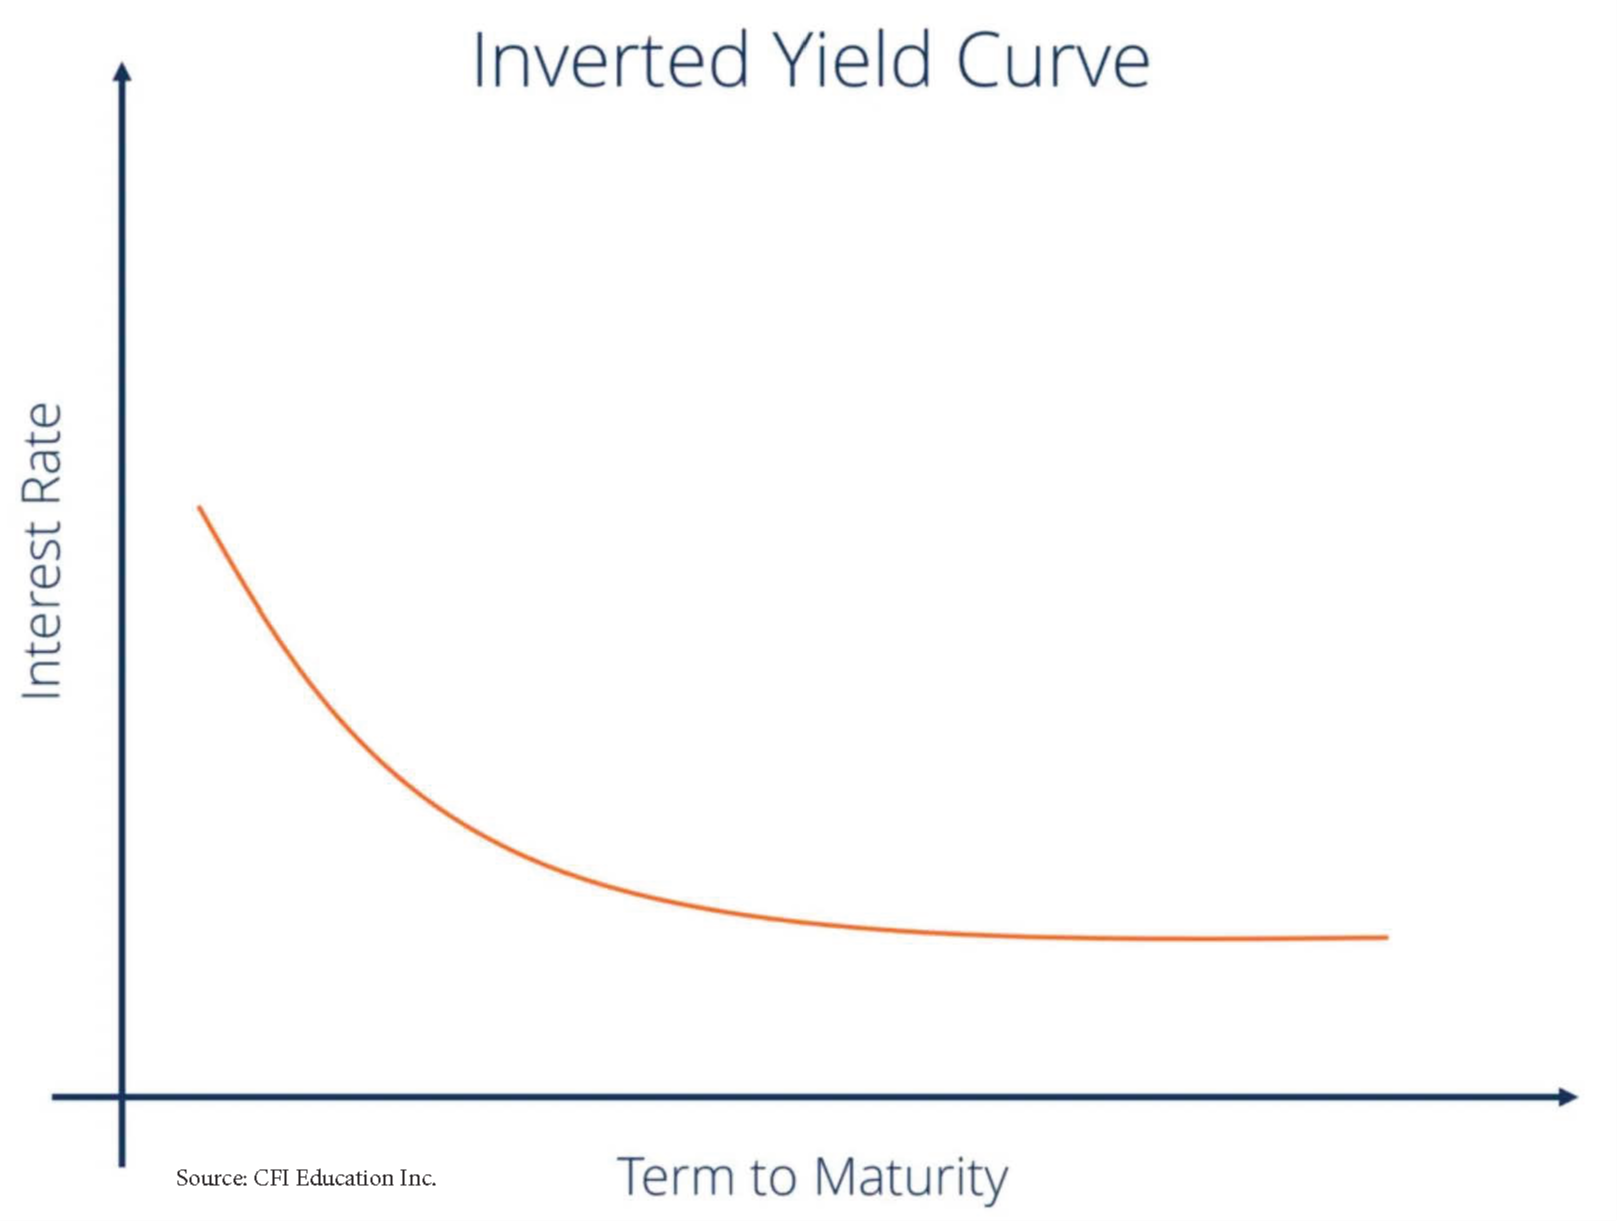
An inverted yield curve occurs when short-term yields are higher than long-term yields. This is often because investors expect interest rates to fall in the future, typically in response to an economic slowdown or recession. Historically, this has been a strong recession indicator.
The Longest Inversion in History—Now Behind Us
The yield curve began inverting in mid-2022 and remained that way until early 2025, marking the longest sustained inversion in U.S. financial history.
But now, we’re seeing that inversion unwind. The curve is starting to steepen again, with long-term yields rising relative to short-term ones. This doesn’t necessarily mean we're out of the woods economically, but it suggests that markets anticipate a more normal interest rate environment in the future.
What This Means for Individual Investors
1) The Recession That Never Came (Yet?) Despite the inversion, a deep recession never materialized. That underscores a key lesson: economic indicators are helpful but not absolute. Markets are complex, and historical patterns aren’t guarantees.
2) Opportunities in Bonds May Shift. During the inversion, short-term bonds and money markets became very attractive—offering high yields with low risk. Long-term bonds may regain their appeal as the curve normalizes, especially if the Fed starts lowering rates. Locking in longer-term yields could make sense in the proper context.
3) Portfolio Positioning May Need Adjusting. Investors who had leaned heavily into short-duration or cash-equivalent instruments should consider whether that still makes sense. With rates potentially peaking, revisiting your bond allocation and time horizon planning may be time.
4) Rate Cuts Could Be on the Horizon. If inflation cools and the economy softens, the Federal Reserve may begin reducing interest rates. That environment typically favors fixed-income and dividend-paying stocks but may also support broader equity markets.
5) The Yield Curve Is a Signal, Not a Strategy. Remember, while the yield curve is a valuable data point, it’s not a substitute for a long-term financial plan. Rather than trying to time the market or guess what the Fed will do next, focus on what you can control—like your asset allocation, spending strategy, and investment discipline.
Bottom Line
Normalizing the yield curve signifies that interest rate expectations are shifting again. This may bring new opportunities for investors but also calls for thoughtful planning. Let's talk if you’re wondering whether your portfolio is aligned with the current environment.
We’re here to help you make sense of the noise and stay focused on your goals.