


With the recent passage of the One Big Beautiful Bill Act (OBBBA), tax policy is once again in the spotlight. One of the bill’s central features—making the 2017 tax cuts permanent—has reignited debate over whether the wealthiest Americans are paying their “fair share.”
Anecdotes like Warren Buffett famously paying a lower tax rate than his assistant stir public emotion, but they don’t always paint a full picture. To better understand the reality, let’s look at the most recent IRS data from 2022 and see who’s really carrying the load when it comes to federal income taxes.
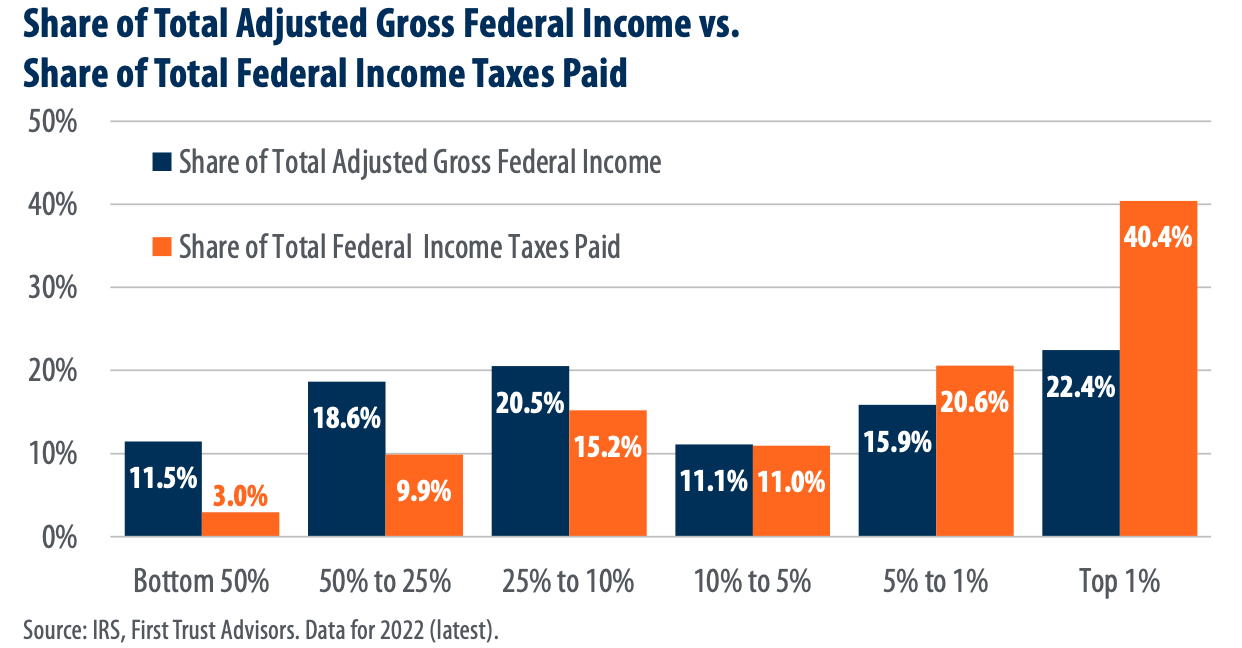
1. The Top 1% Shoulder a Massive Portion of the Tax Burden
According to the IRS:
- The top 1% of taxpayers (those earning $663,000 or more annually) accounted for 22.4% of total income, but paid 40.4% of all federal income taxes.
- Meanwhile, the bottom 50% of taxpayers earned 11.5% of total income, but paid just 3.0% of all federal income taxes.
- Taken together, the bottom 97%of taxpayers paid less in total taxes than the top 1% alone.
This data highlights just how progressive the current income tax system is—despite the frequent narrative that it favors the wealthy.
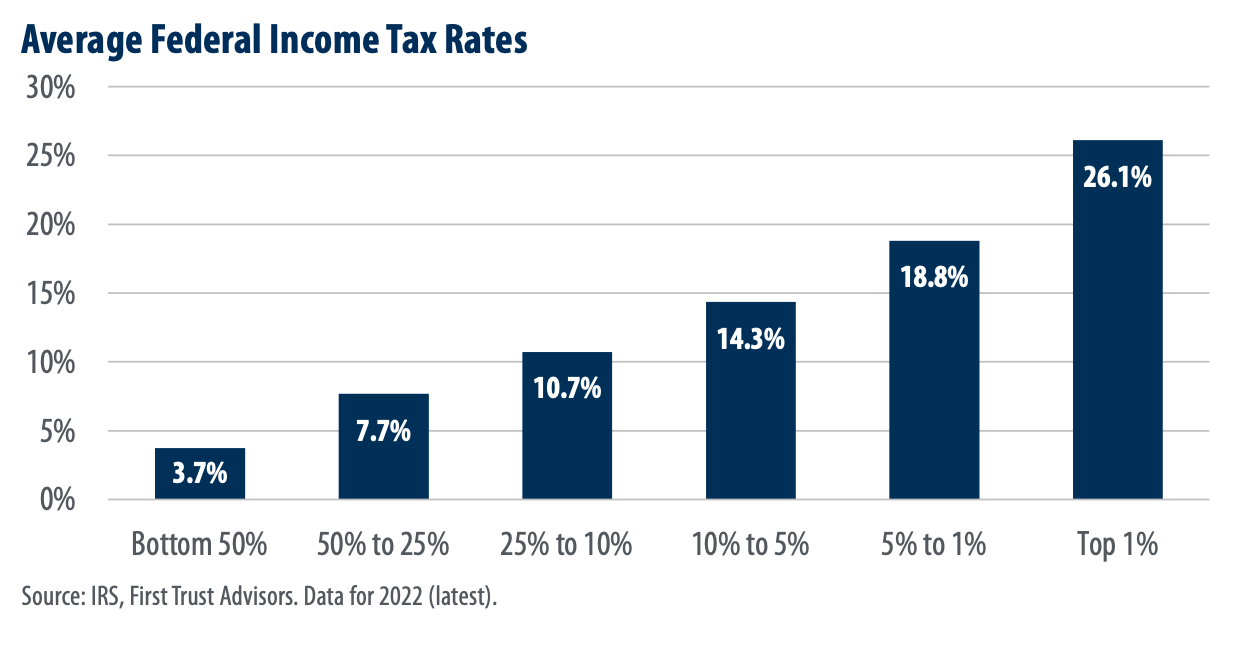
2. Tax Rates Tell a Similar Story
Let’s talk about effective tax rates, which reflect how much people actually pay as a percentage of income:
- The top 1% paid an average federal income tax rate of 26.1%.
- The bottom 50% paid an average rate of just 3.7%.
- That’s a sevenfold difference in tax burden.
Despite claims that the wealthy are skirting the system, these numbers show they’re paying significantly more—both in total dollars and as a percentage of income.
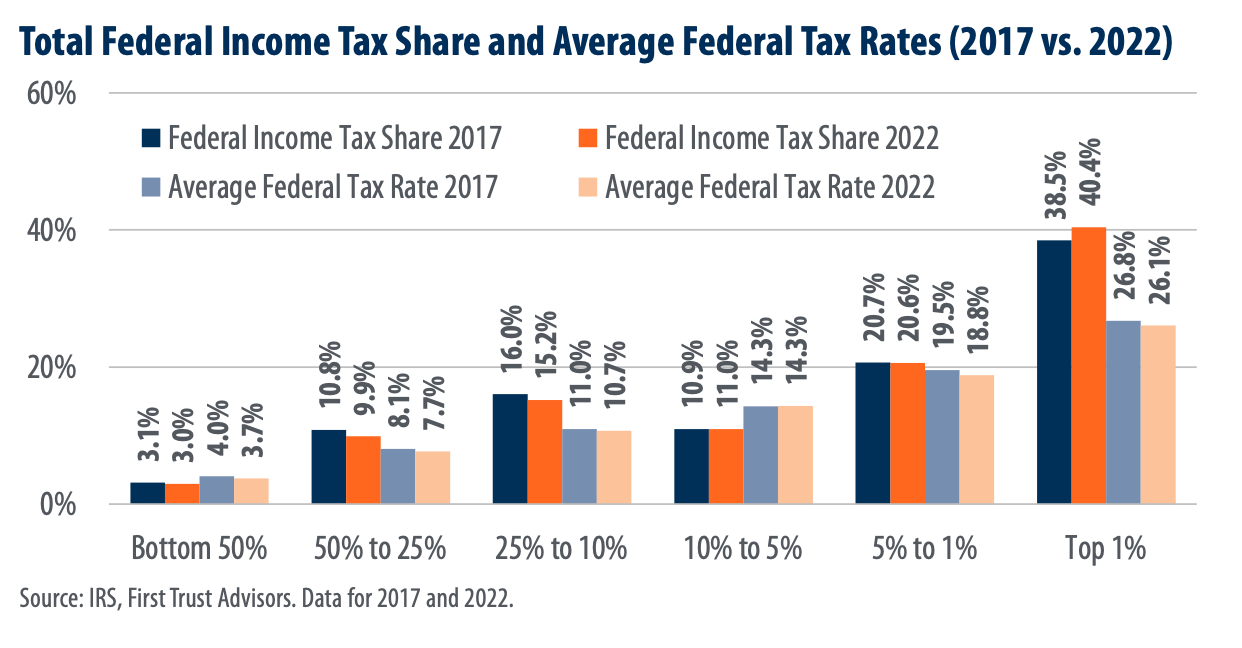
3. What About the 2017 Tax Cuts?
Critics often label the Tax Cuts and Jobs Act of 2017 (TCJA)—frequently called the “Trump tax cuts”—as a giveaway to the wealthy. But the data suggests otherwise:
- Every income group saw a reduction in average tax rate from 2017 to 2022—except the 10–5% bracket, which remained flat.
- The top 1% actually saw their share of total taxes paid increase, from 38.5% in 2017 to 40.4% in 2022.
- The bottom 50% saw their share fall slightly, from 3.1% to 3.0%.
These shifts indicate that the TCJA did not disproportionately benefit the wealthy and that its effects were broadly distributed across income levels.
Final Thoughts: A Progressive System, Backed by Data
When it comes to taxes, perception and reality often diverge. The most recent IRS data shows that:
- America’s income tax system remains highly progressive.
- The top earners contribute the largest share of tax revenue.
- Average taxpayers benefited from rate reductions under the 2017 tax law.
As debates continue around fairness and fiscal responsibility, it’s essential to ground the conversation in facts, not headlines.
If you’d like help understanding how tax policy impacts your personal or business finances—or want a second opinion on your current strategy—reach out today to schedule a planning conversation.